Location >>
 Date:2024-01-18
(January 17, 2024)
National Bureau of Statistics
We comprehensively deepened reform and opening up, intensified macro-control, and focused on expanding domestic demand, optimizing the structure, boosting confidence, and preventing and defusing risks. China's economy has rebounded, supply and demand have steadily improved, transformation and upgrading have made positive progress, employment and prices have been generally stable, people's livelihood has been effectively protected, and high-quality development has made solid progress.
According to preliminary calculations, China's GDP for the year was 12,6058.2 trillion yuan, an increase of 5.2% over the previous year at constant prices. The value added of the primary industry was 8,975.5 billion yuan, an increase of 4.1 percent over the previous year; The added value of the secondary industry was 48,258.9 billion yuan, up by 4.7%; The value added of the tertiary industry was 68,823.8 billion yuan, up by 5.8%. On a quarterly basis, GDP grew by 4.5% in the first quarter, 6.3% in the second quarter, 4.9% in the third quarter and 5.2% in the fourth quarter. On a quarter-on-quarter basis, gross domestic product grew 1.0% in the fourth quarter.
1. Grain output reached a new high, and livestock production increased steadily
China's total grain output was 695.41 million tons, an increase of 8.88 million tons or 1.3 percent over the previous year. Among them, the output of summer grain was 146.15 million tons, down 0.8%; Early rice output was 28.34 million tons, up 0.8%; The output of autumn grain was 520.92 million tons, an increase of 1.9 percent. By varieties, rice output was 206.6 million tons, down 0.9%; Wheat output was 136.59 million tons, down 0.8 percent; Corn output was 28.884 million tons, up by 4.2%; Soybean output was 20.84 million tons, up 2.8%. Oil production was 38.64 million tons, up 5.7%. The output of pig, cattle, sheep and poultry meat was 96.41 million tons, an increase of 4.5 percent over the previous year. Among them, the output of pork was 57.94 million tons, up 4.6%; Beef output was 7.53 million tons, up 4.8%; The output of mutton was 5.31 million tons, up 1.3%; The output of poultry meat was 25.63 million tons, an increase of 4.9%. Milk output was 41.97 million tons, up 6.7%; The output of poultry eggs was 35.63 million tons, an increase of 3.1%. 726.62 million pigs were sold in the year, an increase of 3.8 percent; At the end of the year, the stock of live pigs was 434.22 million, down 4.1%.
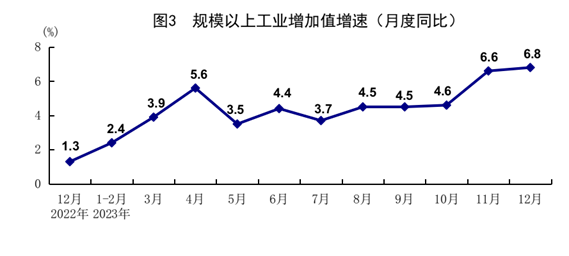
Second, industrial production picked up steadily, and the equipment manufacturing industry grew rapidly
The added value of industrial enterprises above designated size increased by 4.6 percent over the previous year. Divided into three categories, the value added of mining increased by 2.3%, manufacturing increased by 5.0%, and electricity, heat, gas and water production and supply increased by 4.3%. The added value of the equipment manufacturing industry increased by 6.8%, 2.2 percentage points faster than that of industries above designated size. By economic type, the added value of state-owned holding enterprises increased by 5.0%; Joint-stock enterprises increased by 5.3%, and enterprises invested by foreign investors and Hong Kong, Macao and Taiwan enterprises increased by 1.4%. Private businesses grew 3.1 percent. By product, the output of solar cells, new energy vehicles, and generator sets (power generation equipment) increased by 54.0%, 30.3%, and 28.5%, respectively. In December, the value added of industrial enterprises above designated size increased by 6.8% year-on-year and 0.52% month-on-month. From January to November, the total profit of industrial enterprises above designated size nationwide was 6.982.3 trillion yuan, down 4.4 percent year on year; In November, the growth rate was 29.5%, the fourth consecutive month of growth.
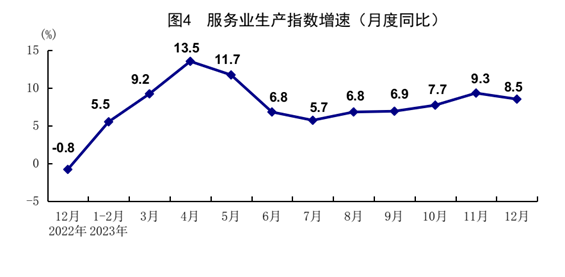
Third, the service sector grew rapidly, and the contact-focused service sector improved significantly
The value added of the service sector grew by 5.8% over the previous year. Among them, the added value of accommodation and catering industry, information transmission, software and information technology service industry, leasing and business service industry, transportation, warehousing and postal industry, financial industry, wholesale and retail industry increased by 14.5%, 11.9%, 9.3%, 8.0%, 6.8% and 6.2% respectively. The index of services production rose 8.5 per cent in December from a year earlier; Among them, the production index of accommodation and catering industry, information transmission, software and information technology service industry increased by 34.8% and 13.8% respectively. From January to November, the operating income of service enterprises above designated size increased by 8.5% year on year. Among them, the operating income of culture, sports and entertainment industry, information transmission, software and information technology service industry, leasing and business service industry increased by 18.9%, 12.8% and 12.7% respectively.
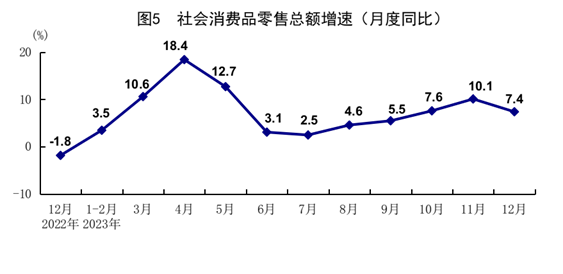
4. Market sales recovered rapidly and service consumption grew rapidly
Total retail sales of consumer goods reached 47,149.5 trillion yuan, an increase of 7.2% over the previous year. The retail sales of consumer goods in urban areas were 40.749 trillion yuan, up by 7.1%; Retail sales of consumer goods in rural areas reached 640.5 billion yuan, up by 8.0 percent. Divided by consumption types, the retail sales of commodities reached 41,860.5 billion yuan, up by 5.8%; The revenue of catering industry reached 5,289 billion yuan, up by 20.4 percent. Sales of basic household goods increased steadily. Retail sales of clothing, shoes and hats, textiles, grain and oil, and food products by units above designated size increased by 12.9% and 5.2% respectively. The sales of upgraded goods grew rapidly, and the retail sales of gold, silver and jewelry, sports and entertainment goods and communications equipment of units above designated size increased by 13.3%, 11.2% and 7.0% respectively. China's online retail sales reached 15,426.4 billion yuan, an increase of 11.0 percent over the previous year. Among them, the online retail sales of physical goods were 13,017.4 billion yuan, an increase of 8.4%, accounting for 27.6% of the total retail sales of consumer goods. In December, total retail sales of consumer goods rose 7.4 per cent year-on-year and 0.42 per cent month-on-month. Retail sales of services increased by 20.0 percent over the previous year.
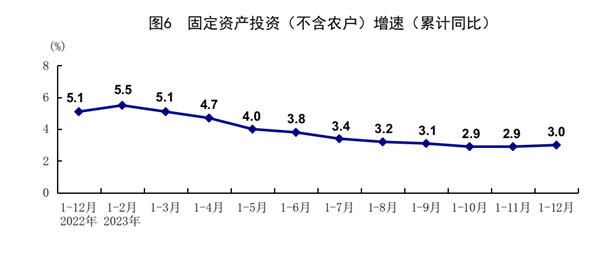
5. Investment in fixed assets increased, and investment in high-tech industries grew well
The investment in fixed assets (excluding rural households) was 50,303.6 trillion yuan, up by 3.0% over the previous year; Adjusted for price effects, the growth rate was 6.4%. By sector, infrastructure investment increased by 5.9%, manufacturing investment increased by 6.5%, and real estate development investment decreased by 9.6%. The total area of commercial housing sold nationwide was 1.1117.35 million square meters, down 8.5 percent. The sales volume of commercial housing was 11,622 billion yuan, down by 6.5%. By industry, the investment in the primary industry decreased by 0.1%, the investment in the secondary industry increased by 9.0%, and the investment in the tertiary industry increased by 0.4%. Private investment fell 0.4 percent; Excluding investment in real estate development, private investment grew by 9.2%. Investment in high-tech industries grew by 10.3%, 7.3 percentage points faster than total investment. Among them, investment in high-tech manufacturing and high-tech services increased by 9.9% and 11.4% respectively. In high-tech manufacturing, the investment in aviation, spacecraft and equipment manufacturing, computer and office equipment manufacturing, and electronic and communication equipment manufacturing increased by 18.4%, 14.5% and 11.1%, respectively. Among high-tech service industries, investment in the transformation of scientific and technological achievements and e-commerce services increased by 31.8 percent and 29.2 percent, respectively. In December, fixed-asset investment (excluding rural households) rose 0.09 per cent month-on-month.
6. The import and export of goods remained stable on the whole, and the trade structure continued to improve
The total value of imports and exports of goods in the year was 41,756.8 billion yuan, an increase of 0.2% over the previous year. Of this total, the export was 23,772.6 billion yuan, up by 0.6%; Imports reached 17.984.2 trillion yuan, down 0.3%. Imports and exports were balanced, leaving a trade surplus of 5.788.4 trillion yuan. The import and export of private enterprises increased by 6.3%, accounting for 53.5% of the total import and export, an increase of 3.1 percentage points over the previous year. Imports and exports to countries jointly building the Belt and Road increased by 2.8%, accounting for 46.6% of the total imports and exports, an increase of 1.2 percentage points over the previous year. Exports of mechanical and electrical products increased by 2.9%, accounting for 58.6% of total exports. In December, imports and exports of goods totaled 3,809.8 billion yuan, up 2.8 percent year on year. Of this total, the export was 2,175.4 billion yuan, up by 3.8%; Imports reached 1,634.5 billion yuan, up 1.6%.
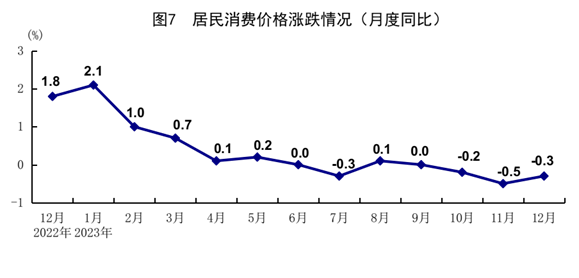
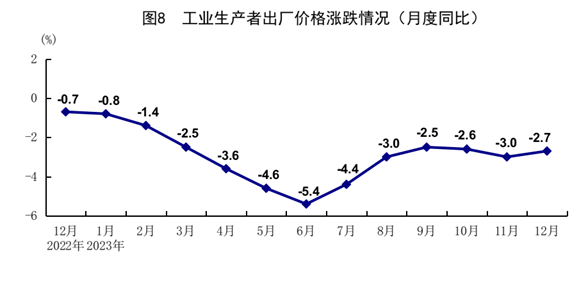
7. The Consumer Price Index rose slightly and the core CPI remained stable on the whole
The consumer price index (CPI) rose by 0.2% over the previous year. The price of food, tobacco and alcohol rose by 0.3%, the price of clothing rose by 1.0%, the price of housing was flat, the price of daily necessities and services rose by 0.1%, the price of transportation and communications fell by 2.3%, the price of education, culture and entertainment rose by 2.0%, the price of medical care rose by 1.1%, and the price of other supplies and services rose by 3.2%. Among food, tobacco and alcohol prices, pork prices fell 13.6 percent, fresh vegetable prices fell 2.6 percent, grain prices rose 1.0 percent, and fresh fruit prices rose 4.9 percent. Core CPI, which strips out food and energy prices, rose 0.7 per cent. In December, the consumer price index fell 0.3 per cent year-on-year and rose 0.1 per cent month-on-month. The producer price index fell by 3.0 percent. December was down 2.7% from a year earlier and 0.3% from the previous month. For the whole year, the purchase price of industrial producers was down 3.6 percent. It was down 3.8% year-on-year in December and 0.2% month-on-month.
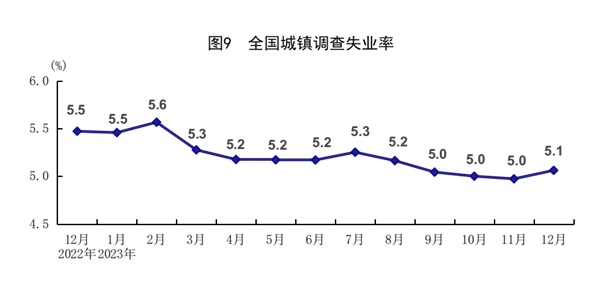
8. The overall employment situation was stable, and the surveyed urban unemployment rate fell
The average surveyed urban unemployment rate was 5.2 percent, down 0.4 percentage points from the previous year. In December, the surveyed urban unemployment rate was 5.1 percent. The surveyed unemployment rate of the locally registered labor force was 5.2%; The surveyed unemployment rate of the migrant registered labor force was 4.7%, of which the surveyed unemployment rate of the migrant agricultural registered labor force was 4.3%. The surveyed unemployment rates for those aged 16-24, 25-29, and 30-59 excluding school students were 14.9%, 6.1%, and 3.9%, respectively. The surveyed unemployment rate in 31 major cities was 5.0%. The average weekly working hours of employees in enterprises is 49.0 hours. The total number of rural migrant workers was 297.53 million, an increase of 1.91 million or 0.6% over the previous year. Among them, local migrant workers reached 120.95 million, down 2.2%; 176.58 million migrant workers worked outside the city, up 2.7 percent. The average monthly income of rural migrant workers was 4,780 yuan, an increase of 3.6 percent over the previous year.
9. Personal income continued to increase, and the income of rural residents grew faster than that of urban residents
The per capita disposable income was 39,218 yuan, an increase of 6.3 percent in nominal terms and 6.1 percent in real terms after deducting price factors. The per capita disposable income of urban residents was 51,821 yuan, an increase of 5.1 percent in nominal terms and 4.8 percent in real terms after deducting price factors. The per capita disposable income of rural residents was 21,691 yuan, an increase of 7.7 percent in nominal terms and 7.6 percent in real terms after deducting price factors. The median per capita disposable income was 33,036 yuan, a nominal increase of 5.3 percent over the previous year. According to the five equal income groups, the per capita disposable income of the low-income group was 9,215 yuan, the lower middle income group was 20,442 yuan, the middle income group was 32,195 yuan, the upper middle income group was 50,220 yuan, and the high income group was 95,055 yuan. The per capita consumption expenditure was 26,796 yuan, an increase of 9.2 percent in nominal terms and 9.0 percent in real terms after deducting price factors. The per capita consumption expenditure on food, tobacco and alcohol accounted for 29.8 percent of per capita consumption expenditure (Engel coefficient), down 0.7 percentage points from the previous year; Per capita consumption expenditure on services increased by 14.4 percent, accounting for 45.2 percent of per capita consumption expenditure, 2.0 percentage points higher than the previous year.
10. The total population has decreased and the urbanization rate has continued to increase
At the end of the year, China's population (including the population of 31 provinces, autonomous regions and municipalities directly under the Central Government and the active military personnel, excluding Hong Kong, Macao and Taiwan residents and foreign nationals living in 31 provinces, autonomous regions and municipalities directly under the central Government) was 1,409.67 million, a decrease of 2.08 million over the end of the previous year. The number of births was 9.02 million, with a birth rate of 6.39 per thousand. 11.1 million people died, with a mortality rate of 7.87 per thousand. The natural population growth rate is -1.48‰. From the perspective of gender composition, the male population is 720.32 million, the female population is 689.35 million, and the sex ratio of the total population is 104.49 (100 females). In terms of age composition, the working-age population aged 16-59 was 864.81 million, accounting for 61.3% of the national population; The population aged 60 or above was 296.97 million, accounting for 21.1% of the country's population, of which 216.76 million were 65 or above, accounting for 15.4% of the country's population. In terms of the composition of urban and rural areas, the permanent urban population was 932.67 million, an increase of 11.96 million over the end of the previous year; The number of permanent rural residents was 477 million, down 14.04 million; The proportion of urban population in the national population (urbanization rate) was 66.16%, an increase of 0.94 percentage points over the end of the previous year.
All in all, in 2023, China withstood external pressure and overcame internal difficulties, the national economy rebounded and made solid progress in high-quality development, the main targets were successfully achieved, and solid steps were taken to fully build a modern socialist country. At the same time, we must recognize that the current external environment is becoming more complex, severe and uncertain, and economic development still faces some difficulties and challenges. We will intensify macro-control, coordinate efforts to expand domestic demand and deepen supply-side structural reform, coordinate a new type of urbanization with comprehensive rural revitalization, and coordinate high-quality development with high-quality security. We will earnestly enhance economic vitality, forestall and defuse risks, improve social expectations, consolidate and strengthen the momentum of economic recovery, and continue to promote qualitative and effective economic improvement and reasonable quantitative growth.
Notes appended to a book
(1) The growth rate of GDP and its classified items is calculated at constant prices, and the growth rate of industrial added value above designated size and its classified items is calculated at comparable prices, and is the actual growth rate; Other indicators are nominal growth rates calculated at current prices unless otherwise specified.
(2) According to the automatic correction results of the seasonal adjustment model, the quarter-on-quarter growth rates of GDP, industrial added value above designated size, fixed asset investment (excluding rural households), and total retail sales of consumer goods were revised in the past year. The revised results and the quarter-on-quarter GDP data in the fourth quarter of 2023 and the quarter-on-quarter data of other indicators in December 2023 are as follows:
Quarter-on-quarter GDP growth in 2022 and 2023 will be 0.6%, -2.1%, 4.0%, 0.6%, 2.1%, 0.6%, 1.5% and 1.0% respectively.
(3) The statistical scope of industries above designated size is industrial enterprises with annual main business income of 20 million yuan or more.
Since the scope of industrial enterprises above designated size changes every year, in order to ensure that the data of this year is comparable to the previous year, the number of the same period used to calculate the growth rate of various indicators such as product output is as consistent as possible with the statistical range of enterprises in the current period, and there is a difference in caliber with the data published last year. The main reasons are: First, the range of statistical units has changed. Every year, some enterprises reach the scale to be included in the scope of the survey, and some enterprises withdraw from the scope of the survey because of the smaller scale, and there are new and put into operation, bankruptcy, and note (suspension) sale of enterprises. Second, some enterprise groups (companies) product output data exist cross-regional duplication of statistical phenomenon, according to the special investigation of enterprise groups (companies) cross-regional duplication of production was eliminated.
(4) The service industry production index refers to the output change of the service industry in the reporting period relative to the base period after excluding the price factor.
(5) The statistical scope of total retail sales of consumer goods is legal enterprises, industrial activity units and self-employed individuals engaged in commodity retail activities or providing catering services. Among them, units above the quota refer to wholesale enterprises (units and individual households) with annual main business income of 20 million yuan or more, retail enterprises (units and individual households) with annual main business income of 5 million yuan or more, accommodation and catering enterprises (units and individual households) with annual main business income of 2 million yuan or more.
Since the scope of wholesale and retail, accommodation and catering enterprises (units and individual households) above the quota changes every year, in order to ensure that the data of this year is comparable to the previous year, the number of the same period used to calculate the year-on-year growth rate of various indicators such as retail sales of consumer goods above the quota is consistent with the statistical scope of enterprises (units and individual households) in the current period, and there are differences in caliber with the data published last year. The main reason is that every year some enterprises (units, individual households) reach the quota standard to be included in the scope of investigation, while some enterprises (units, individual households) withdraw from the scope of investigation due to the small size of the quota standard, and the impact of new business, bankruptcy, note (suspension) sales enterprises (units, individual households).
Online retail sales refers to the sum of retail sales of goods and services achieved through public online trading platforms (including self-built websites and third-party platforms). Goods and services include physical goods and non-physical goods (such as virtual goods, service goods, etc.).
Total retail sales of consumer goods include online retail sales of physical goods, excluding online retail sales of non-physical goods.
(6) Retail sales of services refers to the sum of the value of non-production and non-business services directly provided by enterprises (industrial activity units and self-employed individuals) to individuals and other units in the form of transactions, aiming to reflect the value of services sold by service providers in the form of money and belonging to consumption, including the retail sales of service activities in the fields of transportation, accommodation, catering, education, health, sports, entertainment and so on.
(7) The growth rate of fixed asset investment is calculated on a comparable basis.
(8) Import and export data from the General Administration of Customs.
(9) Employed persons refer to persons aged 16 and above who have the ability to work and engage in certain social labor for the purpose of obtaining labor remuneration or business income.
(10) In order to better reflect the employment situation, the National Bureau of Statistics has improved the labor force survey statistical system, calculated and released the unemployment rate of the labor force aged 16-24, 25-29 and 30-59, excluding school students, so as to more accurately reflect the employment and unemployment situation of young people who have graduated and entered the society and really need to work. A more complete reflection of the youth from school graduation to stable job process of employment and unemployment.
(11) Migrant workers refer to workers who are still registered in rural areas, work in cities, and engage in non-agricultural labor in local or other places for 6 months or more. Local migrant workers refer to those who work in the townships where their household registration is located. Migrant workers refer to those who work outside the township area where their household registration is located.
(12) The national median per capita disposable income refers to the per capita disposable income of all surveyed households in the order of per capita disposable income from low to high, with the survey households in the middle.
Five equal groups of national per capita disposable income means that all the surveyed households are ranked according to the per capita income level from low to high, and are divided into five equal groups on average. The income group in the highest 20% is the high income group, and so on, it is successively divided into the upper middle income group, the middle income group, the lower middle income group, and the low income group.
(13) Some data are not equal in total and sub-item total due to rounding.
Attached table
Attached map
(Source: National Bureau of Statistics website)